
Originally published at the ASI Blog. This is an account of my experience on the ASI Data Science Fellowship, a transition program for academics interested in commercial machine learning which I took part in Jan-March 2017. I completed a project with a fantastic startup called Origami Energy, with whom I subsequently worked for 2 months as a consultant.
We take for granted that with the flick of a switch we can turn on a light, make a cup of tea, and turn on the TV to watch Game of Thrones each Friday evening. All of this requires energy. But more than that: it requires energy at the right time. I worked with Origami Energy to build tools that ensure that we get the energy we need, when we need it.
Electricity in the UK is distributed by the National Grid. Because electricity is hard to store, the National Grid has to make sure that the amount of energy being generated at any time is equal to the amount of energy being used. This isn’t an easy task. Take solar panels: they produce lots of energy at midday on a sunny day, which is precisely when people are outside and not using much energy. Conversely, long, cold winter’s nights place a huge strain on the grid, in a period when solar generation is at a minimum.
Origami identify where usage is flexible – when we could easily move our usage a little, without disruption – and use smart energy routers to automatically shift that usage to times where load upon the grid is lighter. Imagine you are running a chocolate factory (lucky you); you would use heat to melt the raw chocolate. This involves a big initial use of energy, followed by periodic injections of heat to prevent the chocolate from hardening. Origami’s energy router would figure out how to space those intermittent heatings such that they come at a time where there is plenty of energy available on the grid.
My project involved creating a new system to equip Origami to better understand customers’ energy usage. The first stage was consolidating lots of usage data from hundreds of sites into a single database, which now holds over 3 million metre readings.
There are a few ways in which machine learning could help analysts understand new data.

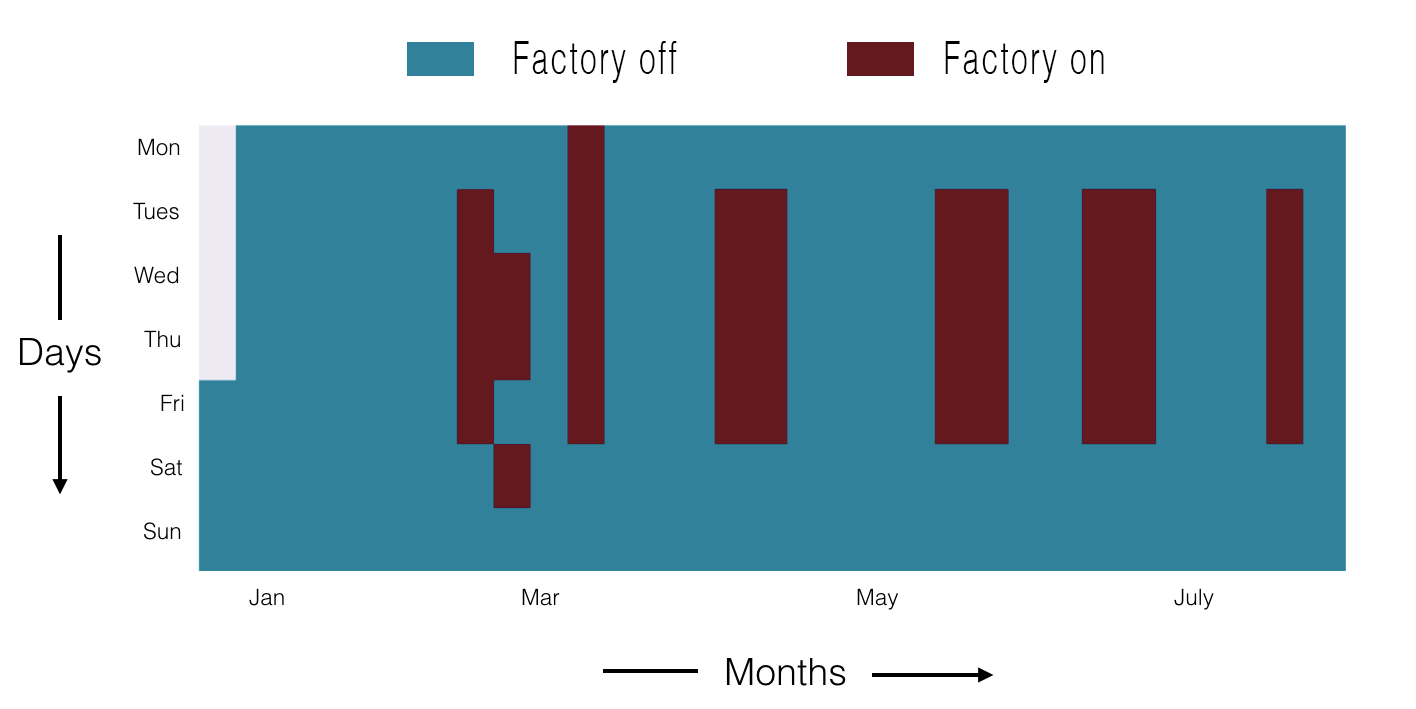
The first challenge is spotting patterns in usage at a single site. Some sites have clear, weekly patterns; offices, for instance, use lots of energy Mon-Fri and a small amount during the weekend. But this isn’t the case for complex industrial premises – like your chocolate factory. They may have a 10-day routine, or turn off every other Thursday in order to perform maintenance. Unsupervised learning algorithms like K-means clustering are excellent at spotting these kind of patterns . We were able to neatly pick out different usage patterns and map them back onto a calendar in order to monitor a specific site.

The second challenge is to understand the relationships between sites. When Origami get new clients, they check whether they are a good complement to other users in their portfolio. In some cases, clients have usage patterns that are anti-correlated – one is high, the other is low, making total demand flat over time. To do this, we need a clean way of comparing different sites; manually comparing data from hundreds of sites with millions of data points (see above) is clearly a non-starter.
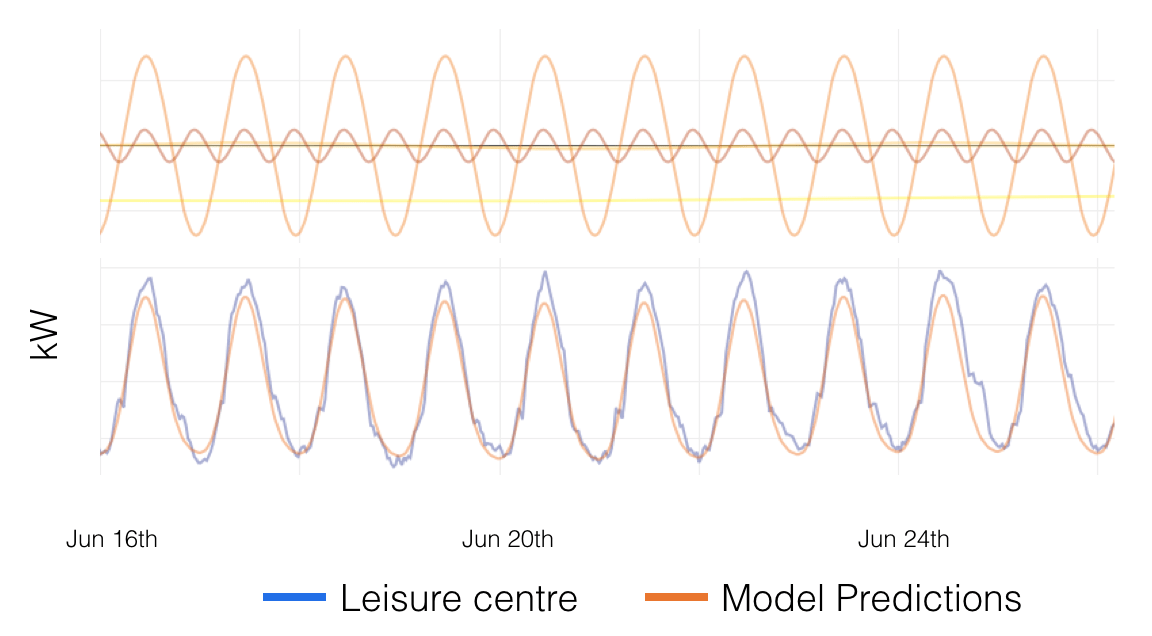
I drew inspiration from the Fourier theorem to create a model which expressed usage in terms of a set of sinusoids with different frequencies – yearly, fortnightly, weekly, daily, and half-daily. By fitting the amplitude and phase of these sinusoids, I got a pretty good description of patterns on varying timescales. Furthermore, this provided an elegant way to compare different sites and allowed me to automatically locate users with matching patterns or complementary patterns.

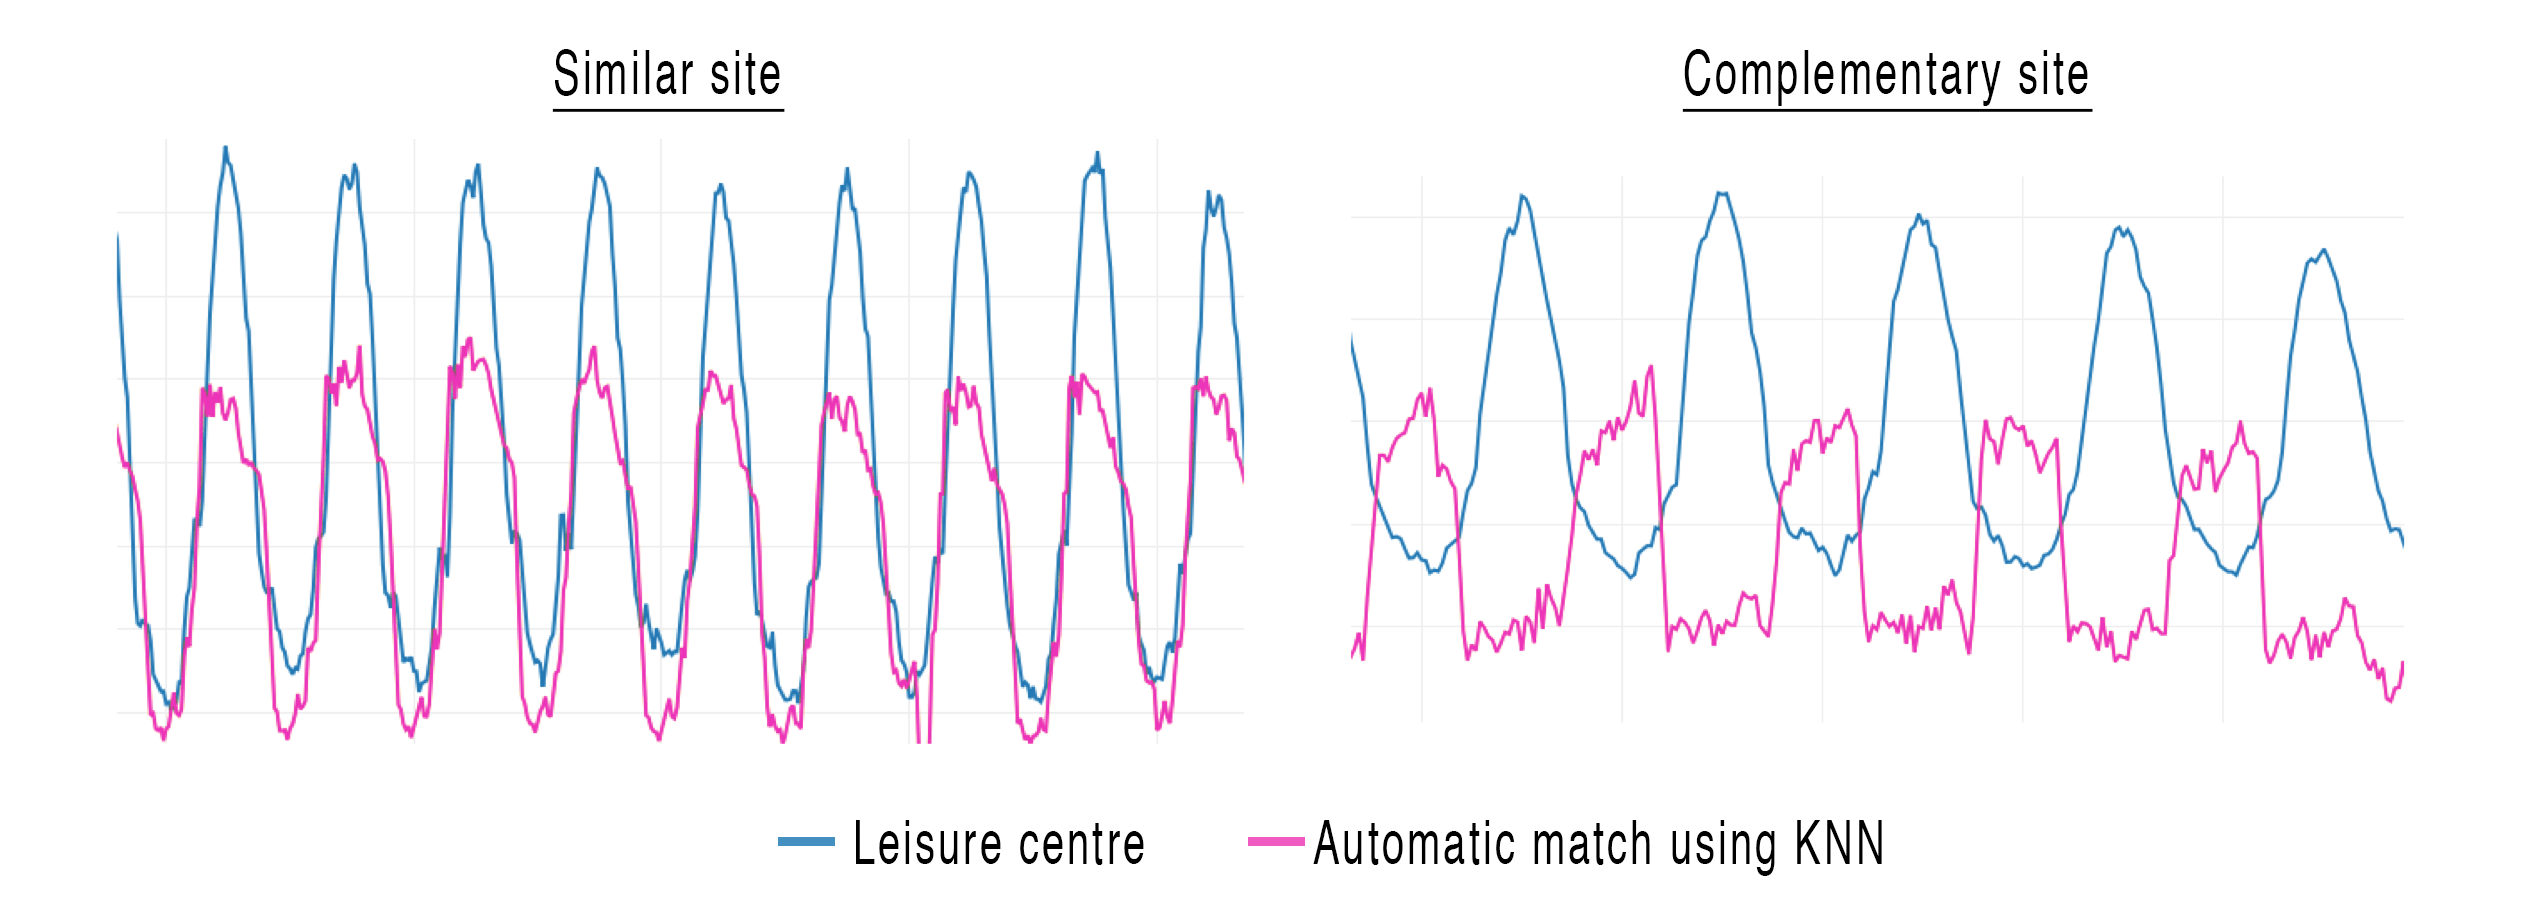
This method paves the way for automatic creation of portfolios, combining sites with complementary usage patterns to provide constant demand over time. This makes it faster and easier for Origami to help balance supply and demand in the National Grid.
Archy de Berker took part in the ASI Fellowship January 2017. Prior to the Fellowship he completed a PhD in Neuroscience at UCL.